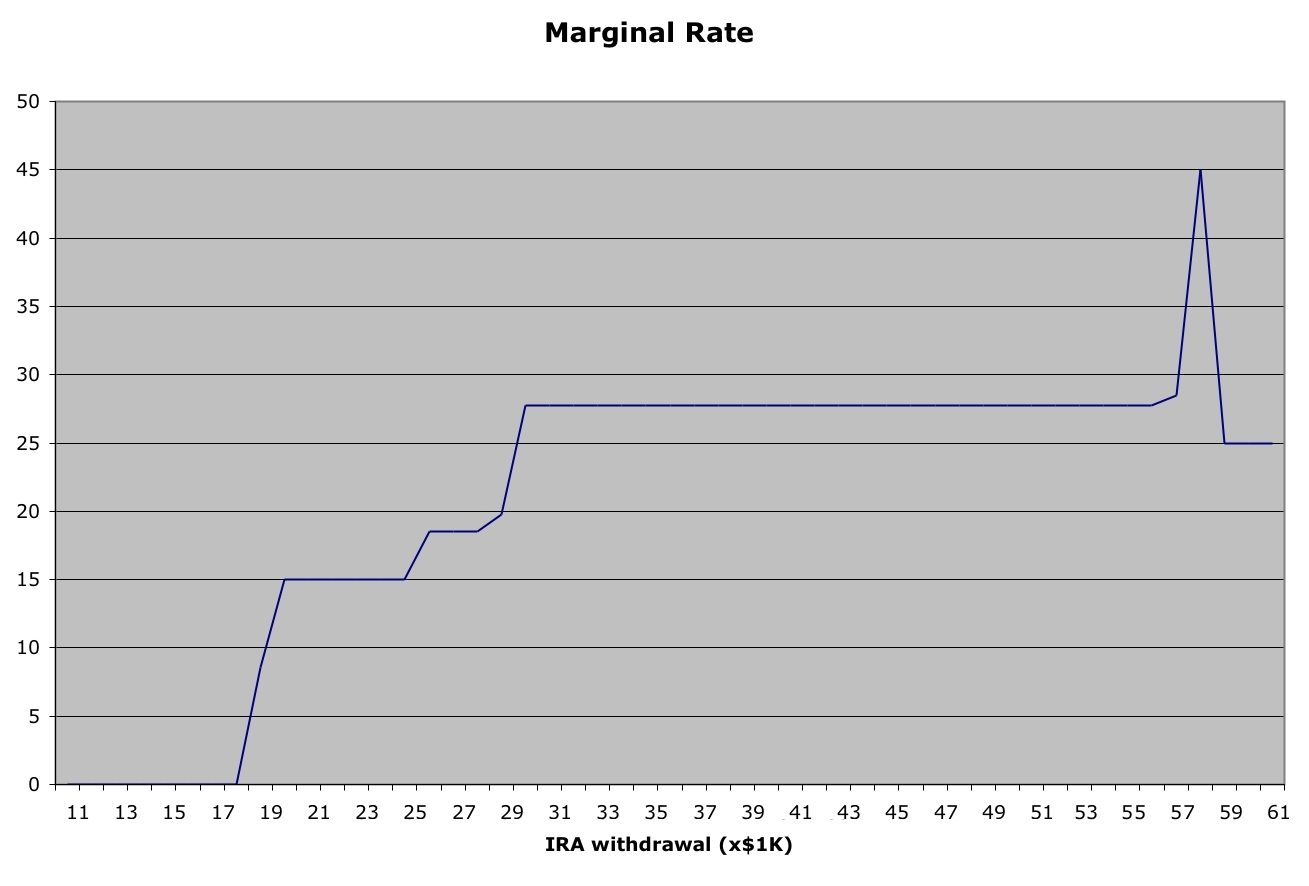
Last week’s Phantom Tax Zone Article was well received. It showed how the phasing in of Social Security taxation can create a phantom 46.25% for a single retiree with $34K in pension income or 401(k) / Traditional IRA withdrawals. Crazy stuff, but knowledge is power, and some planning is in order. Today, let’s look at the same phenomenon as it impacts a married couple filing a joint return. For this chart, we assume a Social Security benefit of $40K combined, as compared to the $20K benefit used for the single. They have their standard deduction of $11,600 and two exemptions of $3,700 each. (Please note, this chart was created using 2011 tax rates, its shape and impact are similar for 2012.) Then, to create the chart, I simply enter a $1000 Traditional IRA (or 401(k)) withdrawal, and note the tax, increasing $1000 each time, and observing how much the tax due rises for that $1000 increased withdrawal. While the couple is still subject to the standard marginal rates, 10%, 15%, 25%, you see here that impact as social security is pulled in to the equation.
Let’s recap the rules for Social Security Taxation;
- file a federal tax return as an “individual” and your combined income*is
- between $25,000 and $34,000, you may have to pay income tax on up to 50 percent of your benefits.
- more than $34,000, up to 85 percent of your benefits may be taxable.
- file a joint return, and you and your spouse have a combined income*that is
- between $32,000 and $44,000, you may have to pay income tax on up to 50 percent of your benefits
- more than $44,000, up to 85 percent of your benefits may be taxable.
- are married and file a separate tax return, you probably will pay taxes on your benefits.
*Note – Your adjusted gross income+ Nontaxable interest+ ½ of your Social Security benefits= Your “combined income”
You can see from these rules that there’s a huge marriage penalty in that the phase in for marrieds is not twice that of singles. The result is that while at first glance you might observe that the shape of the curve for the single’s taxation looks far worse, especially with that 46.25% rate applying to a full $5,000 of income, yet the couple’s rate only hits 45% for $1,000. The thing to look at closely is the income levels across the chart’s bottom. For the couple, the 27.75% rate you see is the result of the 85% taxation of their social security while they are still in the 15% bracket. While they would otherwise expect to see their 15% last until $69,000 of taxable income, they actually exceed the 15% bracket once they pass $19,000 in gross (not net of deductions/exemptions) income. Ouch.
In an upcoming article, some ideas on how to mitigate the impact of this tax.
